Daily POC · Blue line
The session's highest-volume priceHighlights the price level with the highest trading volume during the current session, providing a key reference point for analysing intraday market activity alongside other technical tools.
DEMAND & SUPPLY TRADING INDICATOR
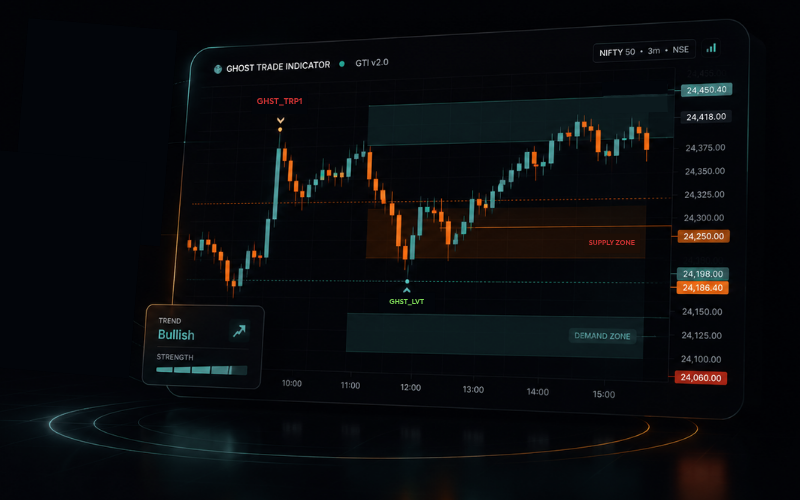
Ghost Trade Indicator (GTI) is designed to help traders identify potential demand and supply zones, volume-based price structures and important market levels to support their trading analysis.
Already used by professional tradersacross India’s markets, every session
What GTI puts on your chart
Ghost Trade Indicator brings three connected tools into a single, consistent view on TradingView. Each one reads the same market from a different angle — zones, activity, and control levels — so your chart tells one clear story instead of a cluttered one. Designed to help traders organize market information with greater clarity, it highlights important price areas and market behavior without relying on subjective chart marking. Explore each feature below to understand how our indicator contributes to your overall market analysis.
01 Feature
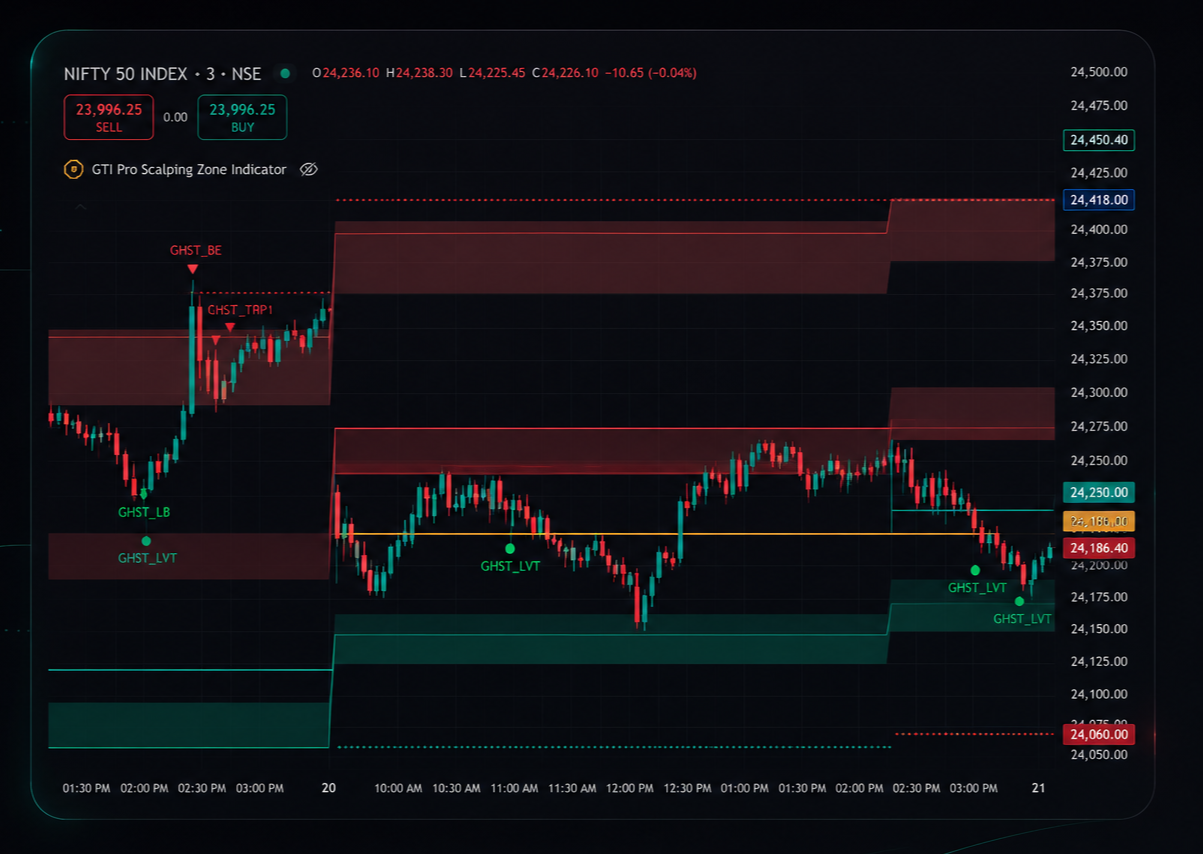
Automatically identifies demand and supply zones based on historical price behaviour, providing objective reference levels for support and resistance analysis.
02 Feature
Colour-coded candles highlight buying pressure, selling pressure, and periods of increased market activity using price and volume analysis.
Highlights candles with above-average buying pressure and increased traded volume relative to recent market activity.
Highlights candles showing elevated selling pressure and potential weakness based on price and volume behaviour.
Highlights unusual market activity that may precede increased volatility. Users may monitor subsequent price action for confirmation.
03 Feature
Daily and Weekly Point of Control (POC) levels identify high-volume price areas that traders can use as additional market context.
Daily POC · Blue line
The session's highest-volume priceHighlights the price level with the highest trading volume during the current session, providing a key reference point for analysing intraday market activity alongside other technical tools.
Weekly POC · Orange line
The week's highest-volume priceHighlights the price level with the highest traded volume during the trading week, providing a broader technical reference for analysing weekly market structure alongside other technical tools.
Daily and Weekly POC levels are generated using historical trading volume data and are provided for educational and analytical purposes only. They should not be interpreted as investment advice, trading recommendations, or assurances of future market behaviour.
Beyond the chart
From long-form podcasts to daily market breakdowns, the GTI community learns out loud. Catch the conversations, live sessions and social clips where we unpack market structure, demand & supply, and the discipline behind every trade. Hover a card to preview, click to watch.

 YouTube
 Podcast
 Podcast
 Podcast
 Podcast
 YouTube
Traders across India use GTI to bring structure to their sessions. A few of their words.
"My chart used to have seven indicators and no clarity. Now it has one, and I finally understand what I am looking at."
"The non-repaint zones changed how I prepare. My levels are marked before the market opens and they stay where they are."
"I joined for the indicator and stayed for the masterclasses. The way demand and supply is explained finally made it click."
"The Daily POC plus colour candles gives me one honest read of the session. My overtrading dropped the month I started."
"I work a full-time job. The weekly POC and zones let me plan trades on Sunday and execute without staring at screens all day."
"Doubt-clearing on Telegram is genuinely active. I asked about a yellow candle setup at night and had an answer by morning."
"What sold me was the honesty. No profit promises, just a framework and the discipline to follow it. That is rare in this space."
"Moved from screenshots of other people's trades to reading my own chart. The four-step framework is now my daily routine."
GTI is a technical analysis toolkit for TradingView. It plots non-repaint demand and supply zones, recolours candles based on price and volume behaviour, and marks Daily and Weekly Point of Control levels, so you can analyse market structure with one consistent view.
No. Zones are calculated from historical price behaviour and stay where they were plotted. What you review after the session is what you saw during it.
Any symbol and timeframe available on TradingView: NSE and BSE stocks, index options, and commodities. The colour logic and POC levels adapt to whichever chart you open.
No. GTI is an analysis and education tool, not an advisory service. It highlights market activity so you can build your own view. Every trading decision, including risk management, remains yours. We do not provide buy or sell recommendations.
Fill in the contact form. Our team will connect with you, add the indicator to your TradingView username, and walk you through the setup along with access to the learning sessions.
Join thousands of traders who use the GTI Pro Scalping Zone Indicator to read structure with clarity and plan every session with confidence.
Built for Scalpers. Trusted by Professionals.
Book a walkthrough
Share your details and our team will reach out on WhatsApp to schedule a live walkthrough of GTI on your chart.
 Subscribe on YouTube
 Join on Telegram
 Follow on Instagram